I'll put this story here since I think it is broadly applicable to the fleet/operators and not just a subtype.
I've been flying my second RV-7 for some 235 hours now, and never been happy with the performance (read: TAS) that I was able to get. This aircraft is well equipped, modern glass (Garmin G3X Touch), 200 HP stock engine, 72" CS BA Propeller...No reason why I shouldn't be able to reach Van's published numbers for the type.
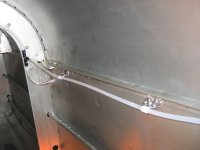
Early on in the build, I was provided a set of static ports that were produced by a local machinist for a commercial aircraft company here in Texas; they looked good, the interface to the static plumbing was simple and leak free, and the installation only required a 1/4" hole -- why not.
Right out of the chute, I noticed that the performance wasn't the same as my previous RV-7 with the same equipment. I tinkered and tinkered and nothing worked. [sigh]... The paint shop called, and I took the airplane in, thinking maybe that a coat or 8 of expensive pigment would help")
The paint shop delivered as promised and I couldn't be happier with the result -- but the airplane was no faster in cruise than before. WTFO?
Flash forward - I decided to gather some data and run it through the tools referenced by Kevin Horton in the following article https://www.kitplanes.com/flight-testing-finding-tas-from-gps-data/
What it showed was eye-opening, my calculated TAS was right in line with what Van's published *and* my altitude above mean sea level was off by +300ft (PALT was 6500, GSL was 6820).
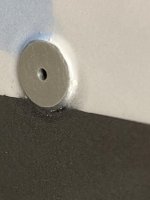
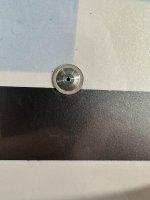
I corrected the static ports by installing a .016" shim between the domed head and the fuselage skin. I flew again, and observed that the airspeed error was <2kts (172.3 Calculated vs 171 Observed) and the altitude was now 40ft low (PALT 6500, GSL 6460).
Learnings:
1. Data is your friend, go get it -- there are countless tools available to help analyze, predict & verify real world effects.
2. If it ain't right, it ain't right -- the fact that the new airplane didn't behave (or indicate the same) as the exemplar should have been a big red flag.
3. Don't be afraid of the answer -- If the data indicates there's a problem, be willing to change the system to fix it, there may be other side effects that are hiding in the data that can kill you. (Altitude difference in the case above).
Pictures attached -- before, and after..
I've been flying my second RV-7 for some 235 hours now, and never been happy with the performance (read: TAS) that I was able to get. This aircraft is well equipped, modern glass (Garmin G3X Touch), 200 HP stock engine, 72" CS BA Propeller...No reason why I shouldn't be able to reach Van's published numbers for the type.
Early on in the build, I was provided a set of static ports that were produced by a local machinist for a commercial aircraft company here in Texas; they looked good, the interface to the static plumbing was simple and leak free, and the installation only required a 1/4" hole -- why not.
Right out of the chute, I noticed that the performance wasn't the same as my previous RV-7 with the same equipment. I tinkered and tinkered and nothing worked. [sigh]... The paint shop called, and I took the airplane in, thinking maybe that a coat or 8 of expensive pigment would help
The paint shop delivered as promised and I couldn't be happier with the result -- but the airplane was no faster in cruise than before. WTFO?
Flash forward - I decided to gather some data and run it through the tools referenced by Kevin Horton in the following article https://www.kitplanes.com/flight-testing-finding-tas-from-gps-data/
What it showed was eye-opening, my calculated TAS was right in line with what Van's published *and* my altitude above mean sea level was off by +300ft (PALT was 6500, GSL was 6820).
I corrected the static ports by installing a .016" shim between the domed head and the fuselage skin. I flew again, and observed that the airspeed error was <2kts (172.3 Calculated vs 171 Observed) and the altitude was now 40ft low (PALT 6500, GSL 6460).
Learnings:
1. Data is your friend, go get it -- there are countless tools available to help analyze, predict & verify real world effects.
2. If it ain't right, it ain't right -- the fact that the new airplane didn't behave (or indicate the same) as the exemplar should have been a big red flag.
3. Don't be afraid of the answer -- If the data indicates there's a problem, be willing to change the system to fix it, there may be other side effects that are hiding in the data that can kill you. (Altitude difference in the case above).
Pictures attached -- before, and after..