Kahuna
Moderatoring
About 7 years ago I did an article on flow matching fuel injection nozzles. It has received a lot of attention over the years. Many have referred to it. Flow matching is simply getting your injectors matched IN THE PLANE during normal operations. I wont go into the details of that, its been written about extensively and included in the article above.
Back then about the best we had was an engine monitor that had the data, you just had to write it down, or download it & get it into a spreadsheet. Then it took some excel skills to get then information you needed.
Fast forward to today. I removed my AFS engine monitor and went to a GRT EIS and EFIS integration a few months back. One of the many things companies struggle with is, what do I do myself, and what can others do better. There is a cool FREE service on the web called SavvyAnalysis. They take your data file that you upload, and present it in a way that even an idiot can understand graphically. This only happens due to 2 companies getting together and sharing information.
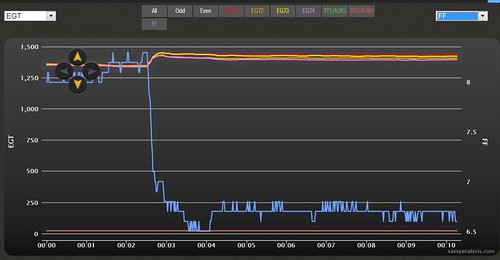
So I take a recording of my GRT data while leaning the motor. A simple couple of buttons to record a demo file while flying and a USB stick in the panel. Come home. Throw the stick in the computer, Jump on a web browser, upload it to SavvyAnalysis, and whammo, I get this cool plotting diagram.

Taking this data, I noticed I now have a .5gph spread across the nozzles at peak. It was .1gph 1500 engine hours and 7 years ago. No idea why, but Ill figure it out and deal with it. Not the point of this message.
The point of this message is how we get to use the cool systems we have, some technology on the web, and some companies getting together to bring a very useful tool to us.
You want to play with this yourself? You can. Go to www.savvyanalysis.com, create your free account. Create your plane and profile, Grab my GRTDemoFile and save it locally to your computer. Then upload the file to Savvy and preview it. You can play with all kinds of stuff they have and see what it does. Pretty neat stuff. Enjoy
Back then about the best we had was an engine monitor that had the data, you just had to write it down, or download it & get it into a spreadsheet. Then it took some excel skills to get then information you needed.
Fast forward to today. I removed my AFS engine monitor and went to a GRT EIS and EFIS integration a few months back. One of the many things companies struggle with is, what do I do myself, and what can others do better. There is a cool FREE service on the web called SavvyAnalysis. They take your data file that you upload, and present it in a way that even an idiot can understand graphically. This only happens due to 2 companies getting together and sharing information.
So I take a recording of my GRT data while leaning the motor. A simple couple of buttons to record a demo file while flying and a USB stick in the panel. Come home. Throw the stick in the computer, Jump on a web browser, upload it to SavvyAnalysis, and whammo, I get this cool plotting diagram.
Taking this data, I noticed I now have a .5gph spread across the nozzles at peak. It was .1gph 1500 engine hours and 7 years ago. No idea why, but Ill figure it out and deal with it. Not the point of this message.
The point of this message is how we get to use the cool systems we have, some technology on the web, and some companies getting together to bring a very useful tool to us.
You want to play with this yourself? You can. Go to www.savvyanalysis.com, create your free account. Create your plane and profile, Grab my GRTDemoFile and save it locally to your computer. Then upload the file to Savvy and preview it. You can play with all kinds of stuff they have and see what it does. Pretty neat stuff. Enjoy