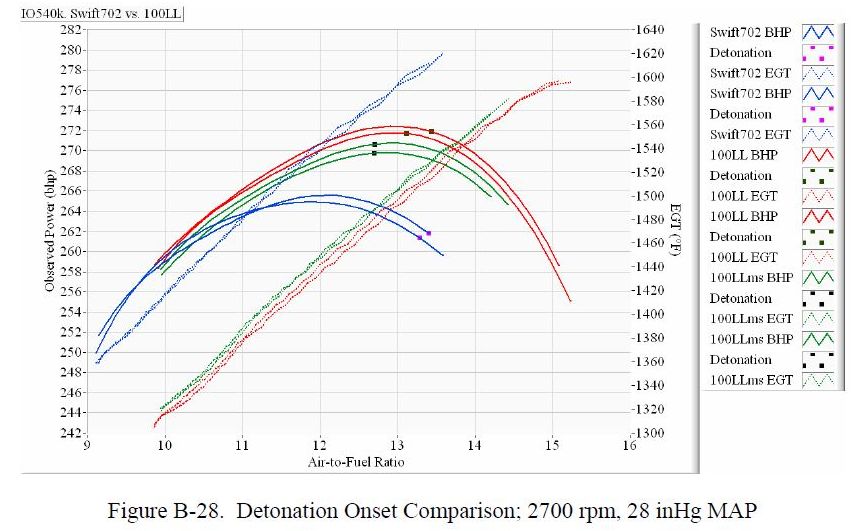
@ Dan, question: in charts B-XX, there are always two power curves, close to each other, with a legend on the right side implying that there are two sets of data being depicted, but I am not seeing anything explaining why two. What am I missing?
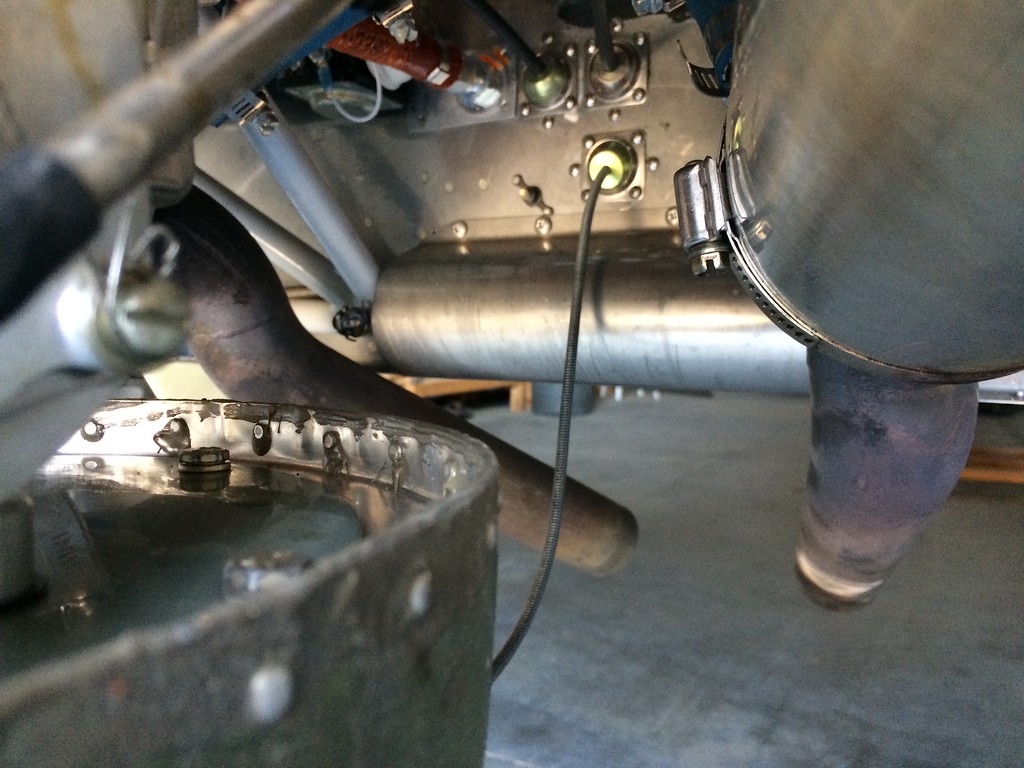
@ Tom, perhaps you know this already, in that case forgive the repetition. Early on when my RV was new and I was learning about optimizing my air cooling, someone pointed out to me here that a good way to find baffle air leaks is to remove the cowl, close hangar door, turn off any lights, then shine a flashlight from outside the baffles (reverse direction of airflow) inward. I found a few spots I'd missed, for example around the cylinder bases at the back baffle wall. Sealing the remaining spots with RTV dropped cruise CHTs about 10?F.
@ Tom, perhaps you know this already, in that case forgive the repetition. Early on when my RV was new and I was learning about optimizing my air cooling, someone pointed out to me here that a good way to find baffle air leaks is to remove the cowl, close hangar door, turn off any lights, then shine a flashlight from outside the baffles (reverse direction of airflow) inward. I found a few spots I'd missed, for example around the cylinder bases at the back baffle wall. Sealing the remaining spots with RTV dropped cruise CHTs about 10?F.
")