RV-14E
Well Known Member
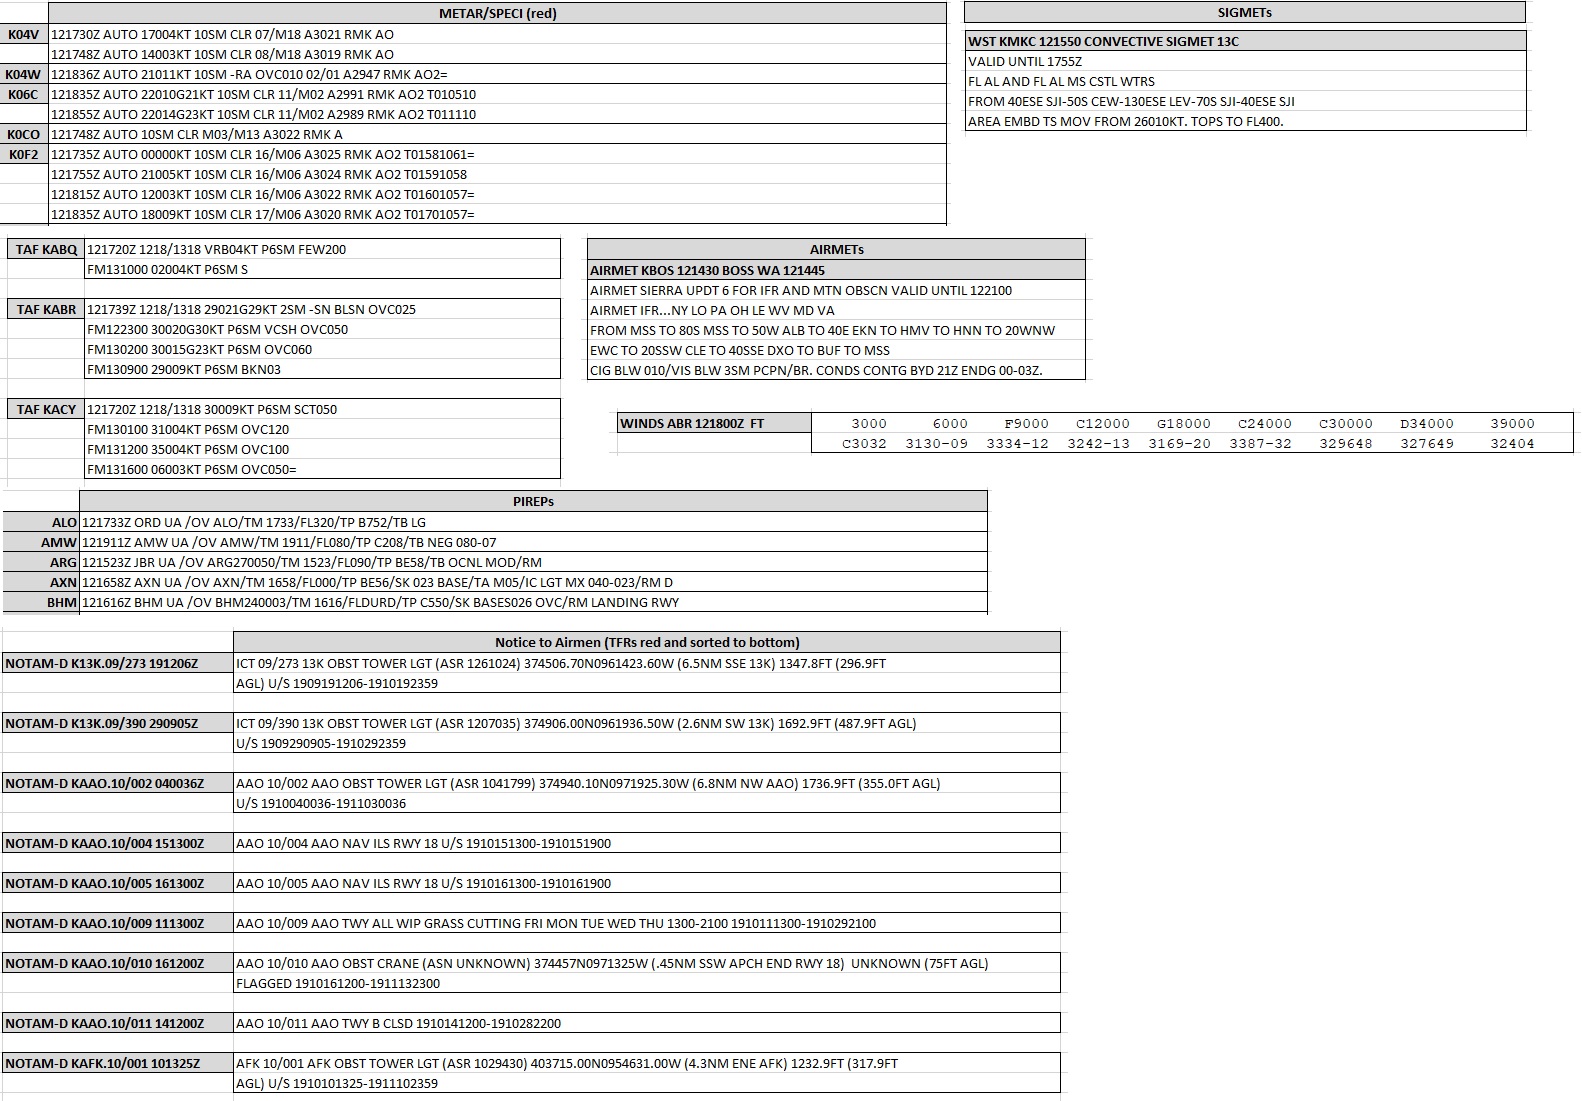
New GRT flight data analysis tools with support for Garmin, Dynon and AFS too.
Updated 3-Jun-20: v4.0 released. View this post for more information.
You can find my free public domain Microsoft Excel-based software here and view much of the information in this post with higher resolution images and embedded videos.
Greetings all.
Last September, I offered a new free tool for GRT users to analyze and view their flight data CSV files. I've since updated it. A lot. And for Garmin and Dynon users, yes, it can look at your CSV files too. But GRT users, with our nearly complete access to EFIS data, get a much cooler picture of our flights. Read on about my updated software.
My original program would take the CSV file recorded from flight, calculate some statistics, graphed various parameters and plot your flight in Google Earth. Example of graphs shown below.

I've since made the code much faster, added a myriad of new parameters and added a "virtual pilot" view so you can watch your flight in Google Earth, rewind, fast-forward, pause, etc., complete with a wind vector representation and a ground course indicator. Example flight over the Sierra Nevadas and Lake Tahoe (from a GRT CSV file).
Flight over Sierra Nevadas
Here's a 4.5-hour flight from 03PR to KEIK compressed to 4 minutes. Again, note the flight director crosshairs and wind vector indicator (from a Garmin CSV file).
4.5 hour flight from San Diego to Colorado
If you're into aerobatics, here are two aileron rolls (from a Garmin CSV file).
Aerobatics
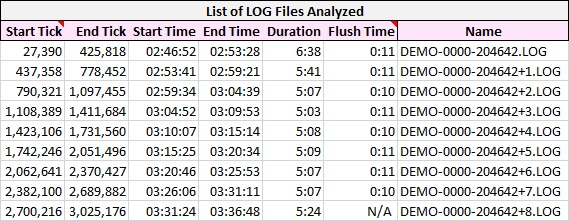
Now, the rest is only for GRT users, and for us, this is where it gets really fun. We all recall that we can record our flight using a "demo recording", for later playback on any GRT EFIS. In those LOG files are all the data from all serial port inputs. Thus, a nearly complete capture of flight data is retained in the LOG files.
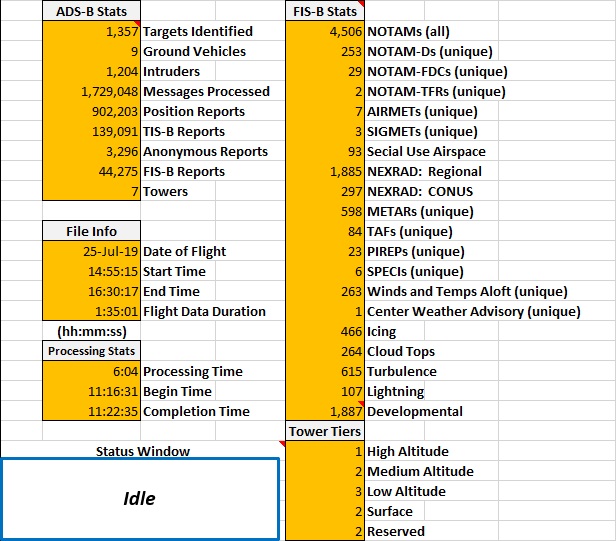
GRT kindly provides the format of those binary files. The files can include data from your ADS-B receiver (Stratux, SkyRadar or any GDL90 compliant device like the GTX-345), should you have it connected to your EFIS. So the demo files have a full record of every ADS-B packet received during your flight. Which means, you can visualize other aircraft with Google Earth and rewind, fast-forward, pause, etc. Let's take a look at what we can now do.
First, you get a lot more parameters to view (see above pic).
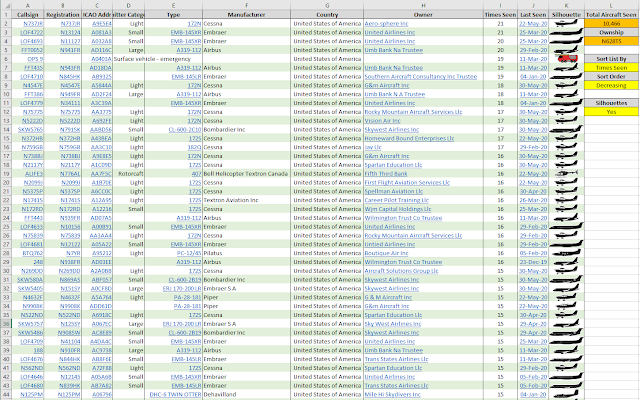
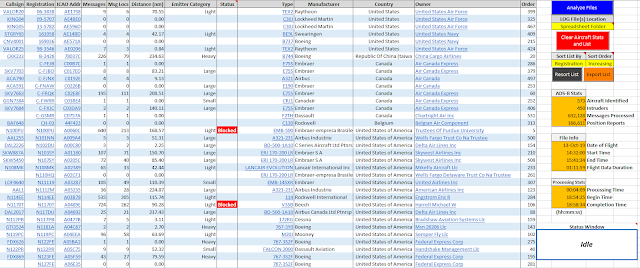
You can get a list of all aircraft in the sky during your flight. A full list is constructed including callsign, registration, type, manufacturer, owner, etc.
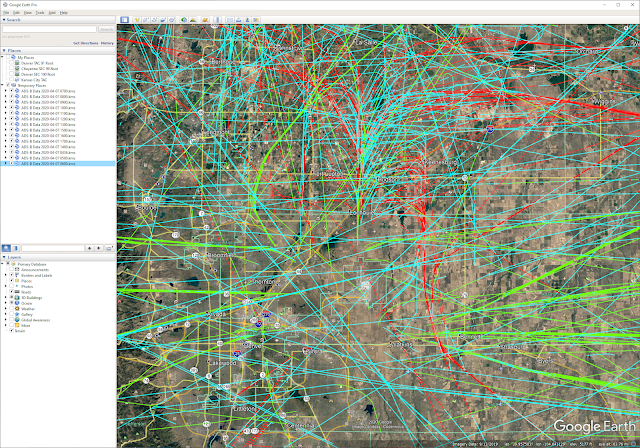
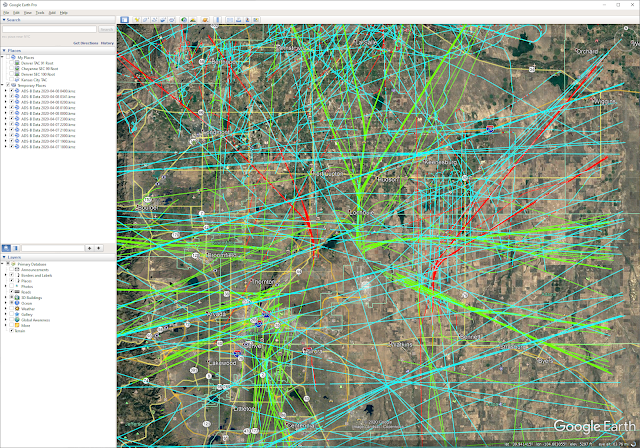
All aircraft flight paths can be rendered in Google Earth at the click of a button. Here are two examples from KDEN. Red is a descending flightpath, green is ascending.
KDEN Traffic 0436 - 1800 UTC.
KDEN Traffic 1800 - 0441 UTC.
Here's an example from very late at night through to in the morning, showing the flight paths of mainly cargo aircraft and passenger transcons.
Front Range, CO traffic 0436-1300 UTC.
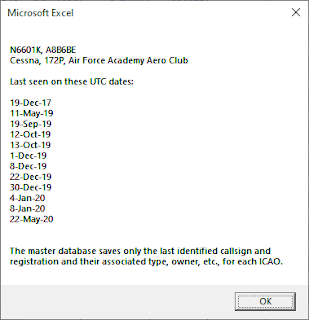
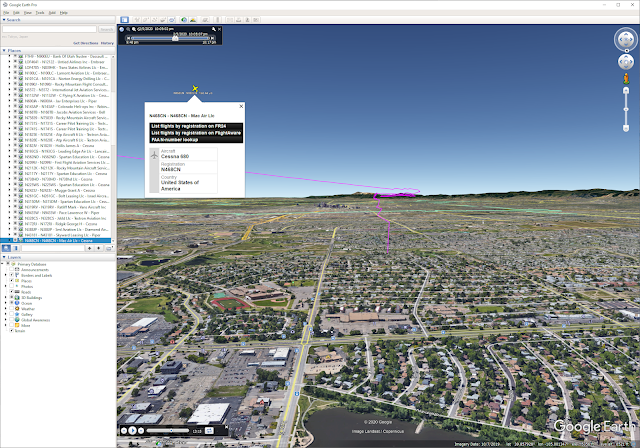
You can click on any aircraft and get a plethora of data about it, including its past flights, owner, type, etc. and even an actual picture of that specific aircraft uniquely determined by its registration. Many aircraft are accurately represented by the more than 30 icons I include.
You can simply get a handle on how many planes are in the sky during your flight.
You can animate your flight with all other aircraft in the sky. ?Ownship? is always the green RV icon. Here's a flight from KMCK to KOIN.
Flight animation from KMCK to KOIN video
In addition to viewing other aircraft from your GRT EFIS' LOG file ADS-B data, you can independently look at data from any Beast Raw (dump1090-based receivers) or GDL90 source (e.g., Stratux., FlightAware, FlightRadar24, ADSBx, etc.). Here's a nearly 24-hour animation of aircraft along the Front Range starting at 0436 UTC and ending at about 0400 UTC the next day.
24-hours of aircraft video
You can click on any aircraft to see its ADS-B report at that time.
Or, you can take the perspective of your cockpit and see the other aircraft flying around you, like this:
Or, you can select any aircraft and hop in to their cockpit to see the situation from their view.
Virtual pilot video
You can project current FAA charts on to the terrain.
FAA charts video
In all cases, you can either use Google Earth's terrain or project any FAA aviation chart onto the terrain instead (e.g., VFR, IFR high/low, etc.).
For short flights, it's quite quick on a modern computer. GDL90 data is faster to process than raw ADS-B data (e.g., from SkyRadar). Though dependent on the number of aircraft in the sky with you, to give you an idea of processing time, my 2-year old computer can process an hour of SkyRadar data in a 1 minute. An hour of GDL90 data processes in less than a minute. Older computers or those with a hard drive (rather than a solid state drive) will be slower.
GDL90 data sources restrict the radius of reported aircraft (to reduce data rate into the EFIS). The SkyRadar passes all data regardless of distance so you will see far more aircraft with a SkyRadar than a GDL90 source. I have run both simultaneously on the same flight and though the SkyRadar sees more, they generally see the same aircraft in your immediate vicinity.
You can find my free public domain Microsoft Excel-based software here and view much of the information in this post with higher resolution images and embedded videos.
Updated 3-Jun-20: v4.0 released. View this post for more information.
You can find my free public domain Microsoft Excel-based software here and view much of the information in this post with higher resolution images and embedded videos.
Greetings all.
Last September, I offered a new free tool for GRT users to analyze and view their flight data CSV files. I've since updated it. A lot. And for Garmin and Dynon users, yes, it can look at your CSV files too. But GRT users, with our nearly complete access to EFIS data, get a much cooler picture of our flights. Read on about my updated software.
My original program would take the CSV file recorded from flight, calculate some statistics, graphed various parameters and plot your flight in Google Earth. Example of graphs shown below.
I've since made the code much faster, added a myriad of new parameters and added a "virtual pilot" view so you can watch your flight in Google Earth, rewind, fast-forward, pause, etc., complete with a wind vector representation and a ground course indicator. Example flight over the Sierra Nevadas and Lake Tahoe (from a GRT CSV file).
Flight over Sierra Nevadas
Here's a 4.5-hour flight from 03PR to KEIK compressed to 4 minutes. Again, note the flight director crosshairs and wind vector indicator (from a Garmin CSV file).
4.5 hour flight from San Diego to Colorado
If you're into aerobatics, here are two aileron rolls (from a Garmin CSV file).
Aerobatics
Now, the rest is only for GRT users, and for us, this is where it gets really fun. We all recall that we can record our flight using a "demo recording", for later playback on any GRT EFIS. In those LOG files are all the data from all serial port inputs. Thus, a nearly complete capture of flight data is retained in the LOG files.
GRT kindly provides the format of those binary files. The files can include data from your ADS-B receiver (Stratux, SkyRadar or any GDL90 compliant device like the GTX-345), should you have it connected to your EFIS. So the demo files have a full record of every ADS-B packet received during your flight. Which means, you can visualize other aircraft with Google Earth and rewind, fast-forward, pause, etc. Let's take a look at what we can now do.
First, you get a lot more parameters to view (see above pic).
You can get a list of all aircraft in the sky during your flight. A full list is constructed including callsign, registration, type, manufacturer, owner, etc.
All aircraft flight paths can be rendered in Google Earth at the click of a button. Here are two examples from KDEN. Red is a descending flightpath, green is ascending.
KDEN Traffic 0436 - 1800 UTC.
KDEN Traffic 1800 - 0441 UTC.
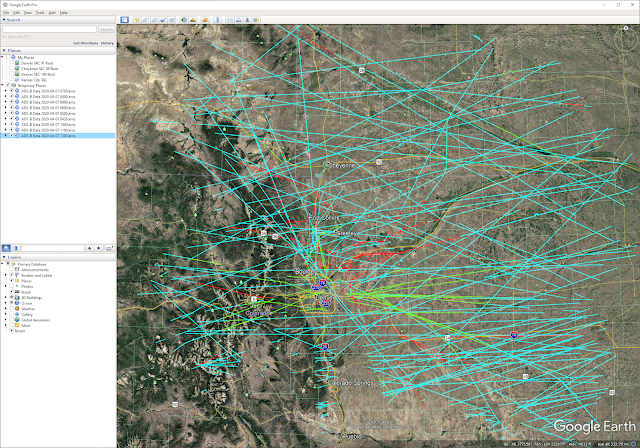
Here's an example from very late at night through to in the morning, showing the flight paths of mainly cargo aircraft and passenger transcons.
Front Range, CO traffic 0436-1300 UTC.
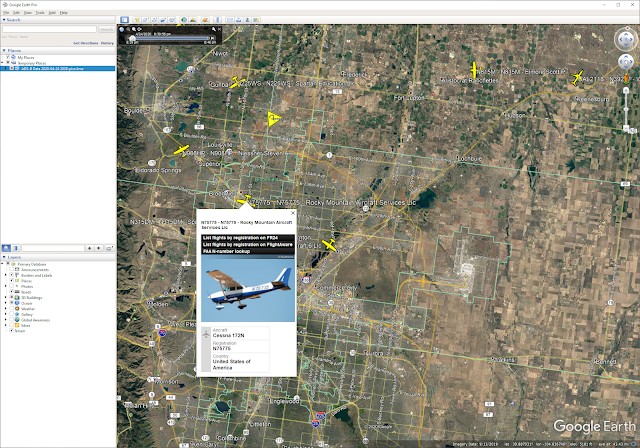
You can click on any aircraft and get a plethora of data about it, including its past flights, owner, type, etc. and even an actual picture of that specific aircraft uniquely determined by its registration. Many aircraft are accurately represented by the more than 30 icons I include.
You can simply get a handle on how many planes are in the sky during your flight.
You can animate your flight with all other aircraft in the sky. ?Ownship? is always the green RV icon. Here's a flight from KMCK to KOIN.
Flight animation from KMCK to KOIN video
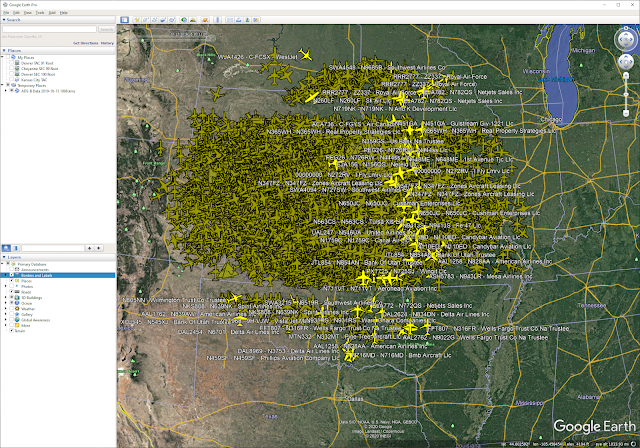
In addition to viewing other aircraft from your GRT EFIS' LOG file ADS-B data, you can independently look at data from any Beast Raw (dump1090-based receivers) or GDL90 source (e.g., Stratux., FlightAware, FlightRadar24, ADSBx, etc.). Here's a nearly 24-hour animation of aircraft along the Front Range starting at 0436 UTC and ending at about 0400 UTC the next day.
24-hours of aircraft video
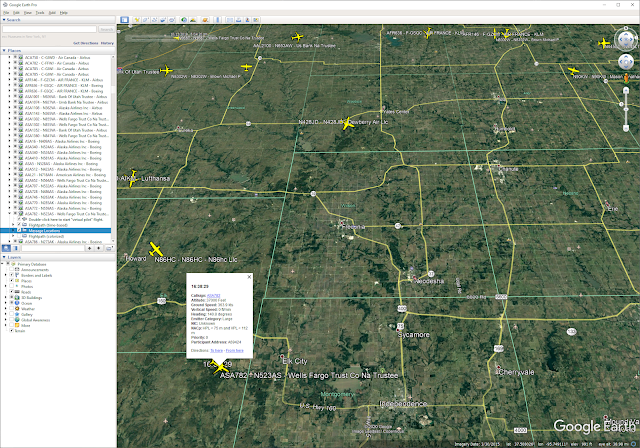
You can click on any aircraft to see its ADS-B report at that time.
Or, you can take the perspective of your cockpit and see the other aircraft flying around you, like this:
Or, you can select any aircraft and hop in to their cockpit to see the situation from their view.
Virtual pilot video
You can project current FAA charts on to the terrain.
FAA charts video
In all cases, you can either use Google Earth's terrain or project any FAA aviation chart onto the terrain instead (e.g., VFR, IFR high/low, etc.).
For short flights, it's quite quick on a modern computer. GDL90 data is faster to process than raw ADS-B data (e.g., from SkyRadar). Though dependent on the number of aircraft in the sky with you, to give you an idea of processing time, my 2-year old computer can process an hour of SkyRadar data in a 1 minute. An hour of GDL90 data processes in less than a minute. Older computers or those with a hard drive (rather than a solid state drive) will be slower.
GDL90 data sources restrict the radius of reported aircraft (to reduce data rate into the EFIS). The SkyRadar passes all data regardless of distance so you will see far more aircraft with a SkyRadar than a GDL90 source. I have run both simultaneously on the same flight and though the SkyRadar sees more, they generally see the same aircraft in your immediate vicinity.
You can find my free public domain Microsoft Excel-based software here and view much of the information in this post with higher resolution images and embedded videos.
Last edited:
")