You can draw most of your own V-N diagram from Van's specifications Load factor
")
(Plus g/Minus g) and the RV-12
V-speeds (Vs, Vo, Vno, Vne). The V-N diagram is based on this. Some points can be derived, calculated, estimated or determined by flight test.... However you have enough to rough out a basic V-N diagram. However they all look very similar.
Get the speeds here:
https://www.vansaircraft.com/wp-content/uploads/2019/02/RV-12iS-POH.pdf
AIRSPEEDS
Stall Flaps Down at gross weight 1320 lbs. VSO 41
Stall at gross weight 1320 lbs. VS 45
Flap Operating Range VSO – VFE 41-82
Normal Operating Range green arc 45-108
Operating Maneuvering VO 1320 lbs. 90
Operating Maneuvering VO 850 lbs. 72
Maximum Structural Cruise VNO 108
Caution Range yellow arc 108-136
Maximum Direct Crosswind Component 11
Maximum Wind Limitation (Ground Operations) 30
Never Exceed VNE red line below 16,000 feet 136
Best angle of climb Vx 60
Best rate of climb Vy 75
FLIGHT LOAD FACTORS
Category Limit Load Factor
Light Sport Category +4.0g/-2.0g
(These are operating limits not structural limits. V-N Diagram is based on LIMITS where structural damage occurs. Operating limits have a margin of safety, typically 1.5 by FAR. Meaning the Airplanes actual strength is equal to or more than +6g/-3g. Use this for the V-N diagram)
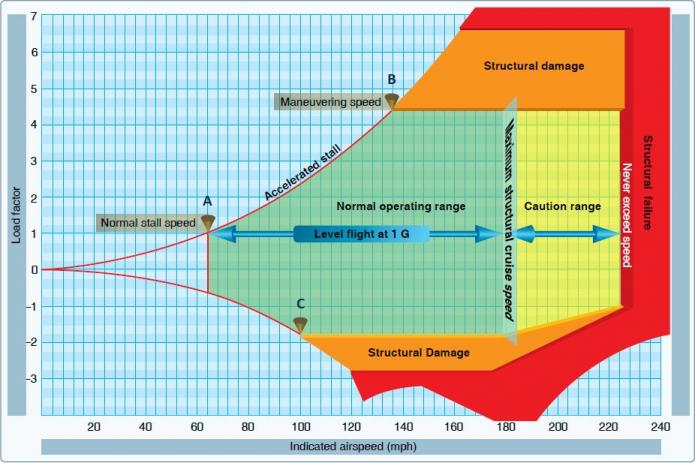
The normal stall speed (point A) is defined by the aerodynamic characteristics of the platform. In the example above the aircraft is capable of developing n=1 (1g) at 62 mph, which is the wing level stall speed of the aircraft.
The intersection of the positive limit of the load factor and the line of maximum lift (point B) defines the maximum airspeed that allows full manoeuverability. This point is called the manoeuver speed or corner speed. At lower speeds, the structure cannot be overstressed as it will stall before reaching the limit load factor. At the manoeuver airspeed the aircraft's limit load factor will be reached at the lowest possible airspeed. At higher speeds, possible structural damage may be caused. In the diagram above, the manoeuvering speed is reached in n=4.4g and IAS=137 mph.
The intersection of the negative limit load factor and line of maximum negative lift capability (point C) defines the maximum airspeed that allows full manoeuverability in a negative lift situation. As the graph shows, airspeeds greater than point C provide sufficient negative lift to damage the structure
The article link above will be a big help in drawing your own diagram up. It really is not needed, the product of the V-N diagram from analysis and flight test are the V-speeds.
https://www.vansaircraft.com/faq/horsepower-limits-why-not-a-turbocharged-higher-horsepower-engine/