

I uploaded my Dynon logs for the last 12 hours of flight time to Savvy today and found an unusual CHT graph I am looking for feedback on. First some background. This is a new IO-360 which has about 50 hours on it now. Usually CHT of all cylinders track each other well and stay below 400F.
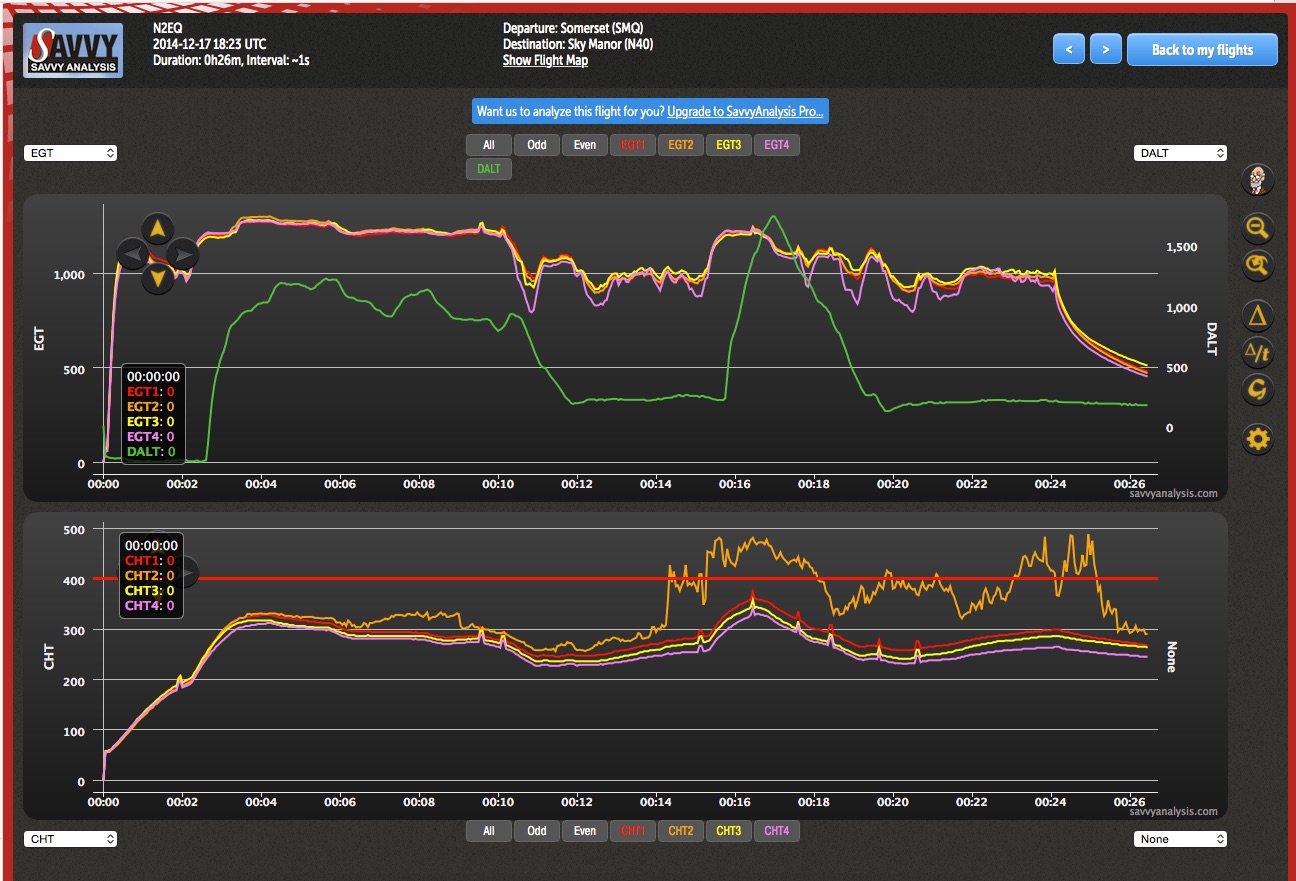
Now to the graph in question. The graph below shows two short flights (I plotted the DALT so you can see when I was flying). Looking at CHT of cyl. #2 it starts departing from the other cylinders during the first flight and then really departs when I was taxing to take of again before the second flight. I didn't notice that during the flight (my CHT alarm WAS set to 500....) . FYI you can ignore the short spikes in the CHT those are cause by my radio transmitting.
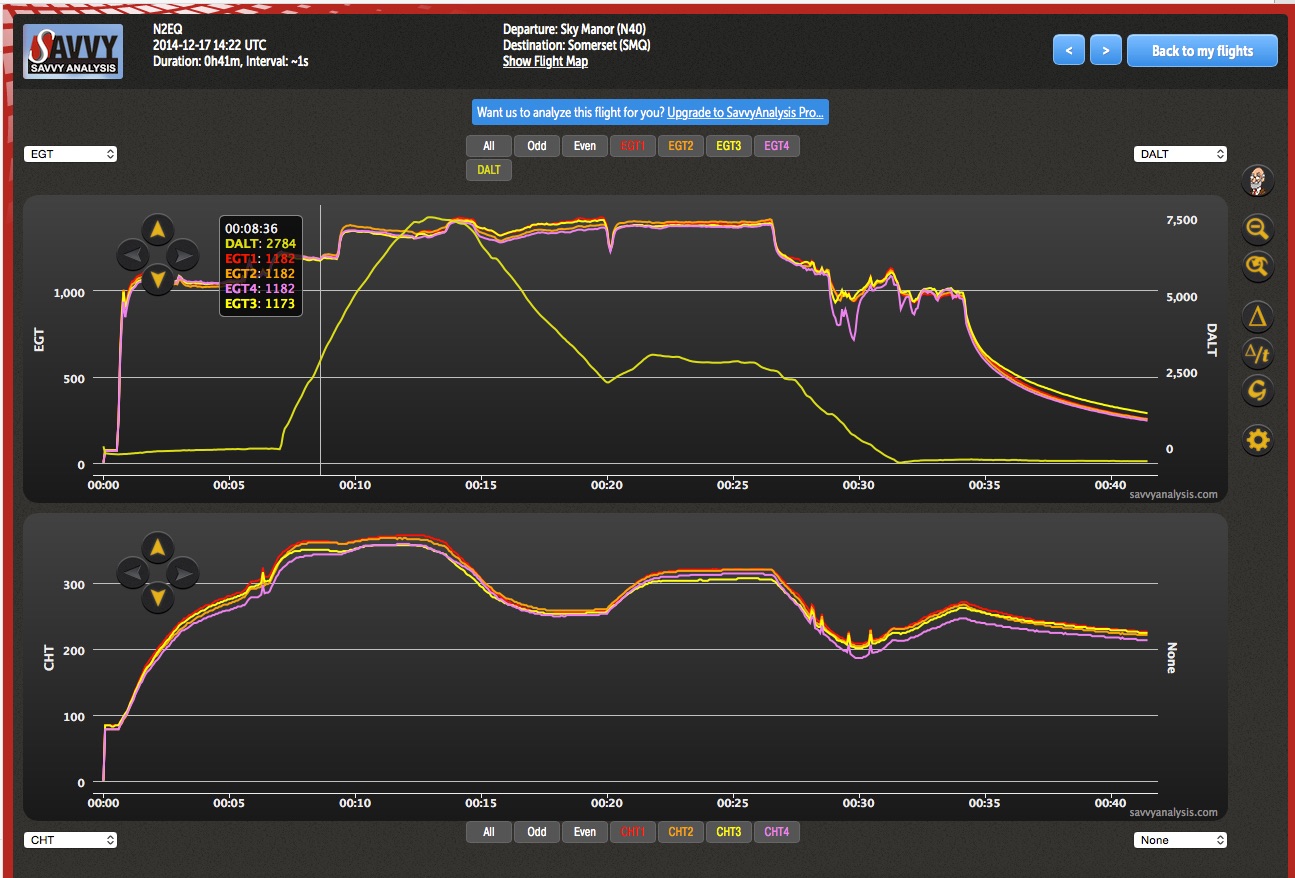
Now after the event everything went back to normal and I have flown 10 hours since without any anomaly. Never saw that issue before or since. E.g. the next flight:
Any idea what that was?
Oliver
Now to the graph in question. The graph below shows two short flights (I plotted the DALT so you can see when I was flying). Looking at CHT of cyl. #2 it starts departing from the other cylinders during the first flight and then really departs when I was taxing to take of again before the second flight. I didn't notice that during the flight (my CHT alarm WAS set to 500....) . FYI you can ignore the short spikes in the CHT those are cause by my radio transmitting.
Now after the event everything went back to normal and I have flown 10 hours since without any anomaly. Never saw that issue before or since. E.g. the next flight:
Any idea what that was?
Oliver

