What's new
Van's Air Force

Don't miss anything! Register now for full access to the definitive RV support community.

Range and Endurance testing

Draker

Well Known Member
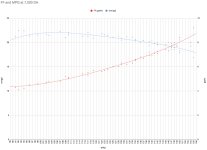
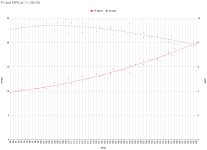
The EAA Flight Test Manual describes a method for Range and Endurance testing. Basically, it involves flying straight and level at various power settings, and plotting those power settings against TAS. Essentially drawing your power curve. Your best endurance will be the lowest point on the curve (where slower speeds require more power).

A couple of questions about this testing. When flying behind a constant speed propeller, best endurance and best range will depend on both RPM and manifold pressure, right? So we want to calculate best range and endurance at a variety of cruise RPMs? Excluding any RPM/MP combinations your prop forbids of course.

Would we expect to see different results at different pressure altitudes? What about air temperatures? I would think working in TAS instead of IAS would cancel out these variables.

How does the mixture knob affect this test? For any given RPM/MP combination, you're going to have different power output if you run rich or significantly lean of peak, right?

Obviously all of the above combinations need to be tested at different aircraft weights to get the full picture.

There seem to be a lot of variables that affect range and endurance.
 
Correct - many variables and each tends to have primary and secondary effects.

Time and data will get what you want. I suggest establishing some objectives on your data taking as in are you going to take the time to clearly define the boundaries or are you going to maximize cruise for your mission? I do the latter.

Some thoughts:
- LOP will alway provide better range, but deep LOP will not. Find the top of the curve. For me, this is ~20 degrees LOP as I find this a nice compromise of good cruise speed for the fuel burn.
- Prop RRM. Your prop is not a linear device. It will be more efficient for the power provided at some RPMs over other. I’ve flown behind fancy composite props that took all the engine power but that did not fully translate to thrust. For my standard Hartzell BA CS prop ~2480 RPM seems like the sweet spot for cruise (and this took more than a year to determine).
- Altitude tends to provide more range - until you run out of engine. Here prop efficiently also comes into play (at least for me) as 16K-18K I am bumping up RPM to keep my normal “high” cruise speed as power has dropped off. Unless there are overriding reasons (winds) I cruise above 8K’, and tend to stay in the range of 8K’ to 12K’. Note - I use oxygen at 8K’ and above.
- For Manifold Pressure this tends to not come into the equation as once above 6K’ or so I’m WOT. For that matter when I take off on cross country the throttle goes full forward and never comes back until let down for landing.

Go out and take a lot of data. You’ll have fun doing it!
Carl
 
Everything Carl says is good information - a lot of variables means lots of test points, which means a fair number of hours of flying. No one ever said that test flying is always exciting - it can be downright boring at times.

This is one reason why the new task-Based Phase 1 is not really about saving time - I have gone through the EAA Flight test manual a few times with new airplanes, and it generally takes close to the 40 hours to get through it all properly. Task-based isn’t about finishing Phase 1 in fewer hours - it is about finishing it with much better data to build a really good Operatign manual for your aircraft. Cruise performance is probably the biggest variation between RV’s - with many different engine, prop, and weight configurations - not to mention the wide variations from fit-and-finish of fairings, you can’t just use someone else’s cruise performance data with any kind of accuracy.

As Carl said - have fun….and I’ll add - learn what you;ve built!

Paul
 
Previous posters have said it well. I'll just add a few more thoughts.
For sure, leaning matters. You'll never get max range at full rich, when you're just pouring fuel thru the engine to help keep it cool.
Many of these tests will produce "steady state" answers. e.g., if I start out at 5000' with a full tank of gas, what's my max range? What about staring at 10,000'? But both ignore the real-world question, "How much gas will I burn getting to altitude?" and "What altitude should I choose to maximize my range on 50 gal (or 20 gal) of gas? (50 vs 20 gal of gas will generate different answers!)
Take a look at a few hypothetical trips; fix the cruise conditions, and vary the climb between Vy and "cruise climb". I think you'll find that there is surprisingly little difference between the total trip time and the total trip fuel burned (unless you lean more aggressively in the cruise climb than at Vy (but this is sort of cheating, as the less lean Vy climb is likely due to CHT considerations)). I agree with others, it's kind of a fun exercise and helps you to really get to know the capabilities of your airplane.
 
I really enjoyed the test flying - it shows you how much more there is to learn about our aircraft.

Here's what I do, hoping to have someone point out something I'm doing wrong. :)

Since Max L/D is so low in an RV (around 100kts), it's unlikely, outside a fuel emergency, that you will fly that slow. At least I don't. That means that you have to pick your speed knowing you are giving up some efficiency. Anything over about 100 kts and you are giving up some efficiency for time.

I too almost always fly at max MP - throttle full forward. Unless I am low and sightseeing. That gives two levers to play with - RPM and mixture.

When in cruise, typically above 7k, you can essentially move the mixture wherever you want without fear of engine damage in a NA engine. I usually bring it back to min fuel burn LOP plus a little bit. (Pretty scientific, I know.) I am giving up a some power for a leaner mixture.

So finally, we have the RPM lever. The RPM changes two things for me when flying cross country - comfort and speed. Higher RPM makes the aircraft go faster, but noise is higher. Not hugely different but you notice it.

The range of speeds and fuel burns available to us is huge, and depends on what you want to do that day in your RV.
 
Do it like a test pilot . . .(?)

You might study up on Kevin Hortons KP article on engine and airplane performance. He kindly allow us to download the information from his own experience including Lycoming on engine performance simulation, and a model of aircraft performance to match.

A pearl . . you only know where you are on the A/F & power curve if at peak EGT. This then allows one to adjust the HP for other fuel flows. Kevin had a spreadsheet that "corrected" or extrapolated the flight data for atmospheric conditions. You only needed a few quality points of data as input. The result was a tool to calculate fuel burn, and airspeed for GW, air density and temperature.

Using his spreadsheets, the projections for full maps of performance were made for my RV7 and a friends RV10. Over the next year we checked them with real flights and they matched very well, usually within a couple of tenths GPH.

My issue on endurance is I still don't know exactly how much fuel my RV7 holds.

Phase I and beyond is a fun time to explore these things.

A huge thanks to Kevin for sharing his work.
 
There's a lot to the range/endurance equation, to be sure. I do a lot of long XC flying, and usually I'm on a mission to "get there" for some reason or another, so I'm running full throttle for the speed. Then mixture and altitude are yours to play with, and you can deal with the winds as they are.

Here is a recent flight I did from my home base in west Texas out to Madera California for the West Coast Formation Clinic - https://flightaware.com/live/flight/N16GN/history/20230428/1245Z/73XA/KMAE

7.3 hours nonstop, just over a thousand nautical miles. I carry 67 gallons in the wings, so fuel was not the problem I was fighting, I still landed with 2 hours in the tanks - but look at my altitude.

We all know that higher is better for fuel consumption, but I started that trip at 8000 for much friendlier winds going westbound (a cold front was pushing in from the north near central Texas) and accepted the higher fuel burn. It wasn't until I approached rising terrain around El Paso (and the winds were backing off) that I made the trade for more altitude, finishing the trip at 12,000'.

My point being - we can do all the advance planning and testing we want, to figure out what our planes will do in still air. But on the day of flight, you want to be able to modify that plane to fit the conditions, and know when your best plan of action may be to accept the fuel burn in exchange for the time, or vice versa. There is no one "point" where we will be able to squeeze the most out of the aircraft outside of perfect test conditions, it's a dance with the environment around you on the day of flight as well.
 
Higher is better. Low rpm is more economical. Wide open throttle is most efficient. Lean of peak is more fuel efficient. Best absolute miles/gallon will be at best glide. On my RV-4 with CS it is around 110 mph TAS 17/17 burning around 3.5 gal/hr. I would try around 8,000, WOT, rpm to suit your speed requirement, 25-50 lean of peak.
 
The bottom of the power curve gives max L/D, i.e. the IAS at which your drag is lowest (which requires the minimum thrust from your engine and therefore should, in theory, maximize your endurance). Once you find that IAS from your tests, you can run some more tests with different combinations of manifold pressure (throttle), RPM, and fuel mixture, to find what is the most efficient (lowest GPH) way to get your airplane to fly at that speed. (I'd guess very low RPM and well lean of peak, about as over-square and hot as your engine manual allows).

As for the best cruise speed (most miles per gallon), that does get more complicated. The power curve tests will give you a starting point (the point in the power curve that has a line to the origin at a lower slope than any other point). However, there are so many nonlinearities (e.g. the impact on fuel burn and on drag i.e. thrust when the speed changes a little, when the RPM changes a little, when the manifold pressure changes a little, when the fuel mixture changes a little) that you might as well go out there, test a bunch of combinations, and find whatever trends you get in your data. This will be hard to do because the power curve can be relatively flat near the cruise speed. In other words, if you're anywhere near the best cruise speed, changing any of the parameters should change your speed by roughly the same as it changes your fuel burn, so the change in MPG will be tiny, so the "signal to noise ratio" in your data will be low. The positive way to interpret this, is: Nailing your best cruise speed is not super important. Most of us fly well faster than that most of the time and still get nearly as good MPG.

(Personally, I have found my best cruise settings using what could be called a hill-climbing algorithm. Find some power settings that seem pretty good, then go: If I increase my RPM a little, do my MPG go up or down? I'll play with that until I hit a peak, i.e. until I find a point where any change in RPM causes a decrease or no change in MPG. From there: If I push the throttle forward a little, do my MPG go up or down? I'll play with that until I hit a peak, i.e. until I find a point where any change in manifold pressure causes a decrease or no change in MPG. Try it again for the fuel mixture. Etc. This, of course, will depend on the altitude...)
 
Careful…

The bottom of the power curve gives max L/D, i.e. the IAS at which your drag is lowest (which requires the minimum thrust from your engine and therefore should, …..)

Nearly everything you posted is correct and good advice, except the first sentence, quoted above. The bottom of the power curve does not coincide with operation at max L/D. It’s easy to confuse ‘power’ and ‘thrust’.
 
I did a couple of short cross country flights to start testing cruise speeds and get a rough idea of range and endurance at a few key power settings. Results are so far... confusing.

RV-7A, IO-360-M1B + Hartzell CS Prop.
Traditional "Slick" magnetos. Timing verified Nov 2021.
I believe the engine is fully broken in (negligible oil consumption).
All gear farings installed.
Air dams behind cowl inlets are sized properly to minimize CHT differences across cylinders.

Cruise performance so far seems to be severely limited by CHT. I cannot cruise at high power without CHTs exceeding my "soft redline" of 400deg. Configurations tested:

  • 25MP/2500RPM = >400deg!
  • 24MP/2500RPM = 380deg
  • 23MP/2500RPM = 360deg
  • 25MP/2400RPM *
  • 24MP/2400RPM = 400deg
  • 23MP/2400RPM = 380deg
  • 25MP/2300RPM *
  • 24MP/2300RPM = 375deg
  • 23MP/2300RPM = 370deg

* - did not test these, I incorrectly believed they were forbidden in the Hartzell manual.

The above were recorded while operating around (but probably not exactly) peak EGT.

I did experiment a little with different mixture settings, and found that if I leaned it out, I can bring the temps and fuel flow way down, by sacrificing power output. The EAA Flight Test manual says nothing at all about the correct mixture setting for these tests, and the Ed Kolano article (which I've also been learning from) says simply to lean "as you intend to lean during normal cross-country flying" which seems imprecise.

My major take-away from these experiments so far is that the major driver of range and endurance is mixture setting rather than MP and RPM settings.
 
Last edited:
Personally, max range is interesting but I never use it.
5+/- hours in an RV? Nope.
Im ready to get out and stretch my legs after 3+/- hours.
 
You’re probably going to continue to have high CHTs if you’re leaning for peak EGT! Try going 50 LOP as a setting - CHTs should drop significantly, and yes, you’ll give up some power (and speed), but it’ll be a couple knots, and those knots are very costly in fuel because when you get to high RV speeds, the drag curve is very steep.

For practical cross- country planning, we generally use 165 KTAS and 8.5 gph for the two-seat RV’s, and the same speed, but 7 gph for the RV-3. For planning, those are close enough - winds aloft will vary enough in real life that trying to plan closer on forecast winds is in the noise.
 
<snip>

For practical cross- country planning, we generally use 165 KTAS and 8.5 gph for the two-seat RV’s, and the same speed, <snip> - winds aloft will vary enough in real life that trying to plan closer on forecast winds is in the noise.

Those are the numbers I've always used on my RV-6 (O-360A1A/Hartzell) for flight planning as well.

Laird
 
In this reply, BobTurner suggested rechecking my (traditional) mag timing. So I hooked up a buzz box and indeed my timing was about a degree and a half advanced (26-27 deg vs 25 which is stamped on my engine). I resynchronized the mags to 25 BTDC and will test out and see if this helps. It can’t hurt to have correct timing.
 
Update

I checked my magneto timing, and lo and behold both were running at 27 deg BTDC. Data plate on the engine says 25 deg BTDC, so I retimed them. CHTs are a little bit cooler now. I can keep them under 400 degrees at all tested cruise powers now up to and including 25"/2600. They're still hovering around 360 degrees during very slow cruise powers, so not great but it's progress. I also cut down the "air dam" in front of my #1 cylinder a little to try to even out temperatures. Now #1 went from the hottest to the coolest (cut too much :mad:).

Now that I'm confident that I'm not cooking the engine, I was able to start really testing cruise performance and economy. Methodology:

  • Climb to 7000 ft density altitude
  • RPM to 2600, WOT (25" MP)
  • Lean to roughly 25 deg LOP, then hands-off mixture control
  • At each MP from 25" down to 13", let airspeed stablize and then record IAS, TAS, FF

Repeat above at 2500RPM, 2400RPM and 2300RPM, re-leaning for each RPM.
Repeat the whole shebang at 11000 ft density altitude (21.5" to 12.5" MP)
Total weight was 1590lbs->1550lbs for the 7000 ft test and 1525lbs->1490lbs for the 11000 ft test.
IO-360-M1B, Hartzell 72" CS prop, RV-7A with all fairings.

Findings/Learnings so far. Most of this is probably obvious to you veteran pilots and aeronautical engineers, but I learned a lot:

  1. At a given TAS, fuel flow doesn't vary much. If I want to cruise at 130 TAS at 7000 DA, I have lots of options: 19"/2300, 18.5"/2400, 18"/2500, 17"/2600. And it's going to be about 6.2-6.3gph no matter which one I choose. That was surprising at first but I guess it makes sense when you think about it.
  2. The fuel flow was slightly lower at the higher DA test, but same finding: It changed with TAS, regardless of the MP and RPM setting used to get there.
  3. Best endurance is the bottom of the power curve, and is the same TAS at both altitudes: For me, 90 KTAS.
  4. Best range found by dividing TAS by FF and picking the TAS with the highest value: For me it was 105 KTAS at both altitudes.
  5. Assuming these values will be roughly the same at all altitudes (they should be as everything is calculated in true airspeed), I should be able to determine best indicated range/endurance at any DA.
  6. My top cruise speed during these tests was 147KIAS/162KTAS at 25"/2500 ~78% power, 9.2gph.

Other random cool things I learned in these flights and questions I'm left with:

  • Autopilot in helps immensely with these tests! Let it hold altitude and I worry about one less thing.
  • I can easily tell when I pass peak EGT without looking at the gauges. Even with constant RPM, you can "feel" the obvious power loss as you cross into economy mixture and go leaner. So cool.
  • Between, say 14" and 17" of MP, tiny, tiny (like 1/8") adjustments to throttle knob make a big airspeed difference. I never really tried nailing and holding precise airspeeds over and over like this until I flew this test plan.
  • All this testing held mixture mostly constant, letting the FI servo do its best at each different MP settings. I wonder if I can zero in on more accurate numbers by leaning at all airspeeds. Dunno.
  • I'm wondering how these figures will change significantly with weight. I have not done any max gross weight testing yet.
  • I also wonder how these figures stack up to similar RV's.

Thanks and sorry for the huge stream of consciousness and data dump. This writing is how I organize my thoughts after these flight tests.
 

Attachments

  • 7000.jpg
    7000.jpg
    159 KB · Views: 102
  • 11000.jpg
    11000.jpg
    164.4 KB · Views: 95
Last edited:
Now that I'm confident that I'm not cooking the engine, I was able to start really testing cruise performance and economy. Methodology:

  • Climb to 7000 ft density altitude
  • RPM to 2600, WOT (25" MP)
  • Lean to roughly 25 deg LOP, then hands-off mixture control

IO-360-M1B, Hartzell 72" CS prop, RV-7A with all fairings.

That is roughly 87% power. Maybe a little too high to be leaning to an LOP of only 25° and transiting the 'Red Fin' at all? I wouldn't be comfortable doing that with my IO-360-M1B.

IMG_0841.jpg

Even with the "Big Mixture Pull", I'd be concerned:

Screenshot 2023-06-03 at 9.04.05 PM.jpg


Screenshot 2023-06-03 at 9.10.14 PM.jpg
 
Last edited:
I do a lot of long-range non-stops, 4-5 hours are pretty frequent and a couple 6+ every year (Reno, Osh, Sun and Fun, a few others). I attended the West Coast Formation Clinic this year in Madera Ca and had the longest legs yet in my plane, 7.3 going and 7.4 returning.

You've got to have good seats for that. I am using Classic Aero Sportsman and love them.
 
Thanks, everyone. Yes, I realize my fuel tanks will likely outlast my bladder.

I did this test to confirm that speeds around XYZ airspeed will stretch my fuel distance-wise, and speeds around ABC airspeed will stretch my fuel time-wise. I think that knowledge is valuable. Also just to get a better feeling for how the plane flies under varying MP/RPM combinations. I thought it was worth doing just for this familiarity.
 
You may want to try 200 rpm, or to re-lean at lower speeds. Because of pumping losses you should see a large change between 2500 RPM and 2200.

I expect if you re-lean you will find that. I did extensive testing in My twin comanche, from 6,000 to 15,000 and consistently could obtain the same thrust at a lower fuel burn (significantly) at lower RPM. Endurance cruise at 2200 or even 2150 RPM was .5 to 1 gph less for each engine, than the same speed at 2450. It was not linear, so I do wonder if there was a sweet spot for the prop.
 
Flight testing.......

Thanks, everyone. Yes, I realize my fuel tanks will likely outlast my bladder.

Indeed! Just to do it one time, I flew the Cub nonstop from Denver to Columbus, MT which turned out to be about 6 hours. Well, THAT was stupid! :rolleyes: I'll not try that again. SuzieQ covers much more territory quickly and is more comfortable than the Cub. 3-4 hours is sometimes an OK leg.

I did this test to confirm that speeds around XYZ airspeed will stretch my fuel distance-wise, and speeds around ABC airspeed will stretch my fuel time-wise. I think that knowledge is valuable. Also just to get a better feeling for how the plane flies under varying MP/RPM combinations. I thought it was worth doing just for this familiarity.

I am happy you started this thread, Ryan. I'm hopeful it will encourage those that have not flown their Phase 1 yet to take it seriously and fly the program like they were in the Society of Experimental Test Pilots! You/They/We/I ARE Experimental Test Pilots. And it is a job that needs to be taken seriously and done methodically and correctly. The EAA has gone a long way by providing (thankfully!) the Flight Test Manual and Test Card Book. But they still need to be done and done seriously. One does not need to just "fly the hours off". I remember back "then" people having other pilots "fly their hours off"! WHAT??? Data needs to be collected so you can KNOW your airplane and its strong and weak points. Going through my flight cards, I could feel SuzieQ (a brand-new airplane that had never been flown) and I getting to know each other better as the hours built up. Again, when I had the required 40 hours, I was not done! I continued to make up further Phase 1-like flight cards with the Small Things. It was great fun!

SO: you are serving as an inspiration to those not yet flying and, maybe, throwing a little guilt on those who might not have done as complete a job as you seem to be doing and perhaps inspire them to explore the "envelope" more extensively! Keep up the good work and keep us abreast of your progress! Fly well!

This is NOT to imply that ANYone did not do their Phase 1 (or flight cards) improperly or wrong. It is just to say it is an important job that needs to be done well. IMHO.....:cool:
 
Last edited:
That is roughly 87% power. Maybe a little too high to be leaning to an LOP of only 25° and transiting the 'Red Fin' at all? I wouldn't be comfortable doing that with my IO-360-M1B.

Thanks for this comment. I mentioned in a previous comment that, like a lot of pilots, my primary flight training kind of glossed over leaning, and it's still an area where I'm lacking knowledge. I was taught the old-school "just find peak and then richen to 25-50 ROP", which modern guidance seems to say is actually hardest on the engine!

I'm still reading Mike Busch and learning about the so-called "red box". My understanding is that the red box / red fin area is a high engine stress area because it can result in high cylinder pressures and high CHTs. I wonder if brief operation in the red box is acceptable for the purpose of documenting max performance for a brand new airplane (even if you don't plan to operate in this area during phase 2)?

I mean, if you're over say 70% power and you want to test / document your performance at max power mixture setting, you're necessarily going to be in the red box, right?
 
I mean, if you're over say 70% power and you want to test / document your performance at max power mixture setting, you're necessarily going to be in the red box, right?

Not necessarily. Look at Carl’s graphs. Best power is usually close to 150 F rich of peak, just outside the red box at 75% power. Ditto for peak egt.
People talk about ‘the big pull’ (e.g., transitioning thru the red box briskly (a few seconds)) and not lingering there. I would not suggest any data taking at, say, 85% power and 100 F ROP. Once an engine goes into detonation you have a minute or two before you melt a hole thru the piston.
 
Thanks for this comment. I mentioned in a previous comment that, like a lot of pilots, my primary flight training kind of glossed over leaning, and it's still an area where I'm lacking knowledge. I was taught the old-school "just find peak and then richen to 25-50 ROP", which modern guidance seems to say is actually hardest on the engine!

Yes, but the general proviso was to do that below 75% power.

I'm still reading Mike Busch and learning about the so-called "red box". My understanding is that the red box / red fin area is a high engine stress area because it can result in high cylinder pressures and high CHTs. I wonder if brief operation in the red box is acceptable for the purpose of documenting max performance for a brand new airplane (even if you don't plan to operate in this area during phase 2)?

Not just high cylinder pressures and high CHTs, but the real possibility of the dreaded "D" word ... Detonation ... if other conditions exist as well, such as high CHTs, high oil temps, and high OATs. For normally aspirated Lycomings with standard compression ratio pistons, you generally can't hurt the engine with the mixture control below 75% power. Indeed, Lycoming defines the 'Best Power' mixture setting as approximately 100°F ROP, and the 'Best Economy' mixture setting as peak EGT, to be used for power settings below 75% power.

But note that 75% power and running between about 50°F to 25°F ROP yields the highest internal cylinder pressures (ICP) (for that power setting) and you would not want to operate there for very long. To minimize the time spent in that high ICP region, some folks like the 'Big Mixture Pull' to LOP and then find peak EGT from the lean side of peak, and then lean to 25°F to 35°F LOP.

I mean, if you're over say 70% power and you want to test / document your performance at max power mixture setting, you're necessarily going to be in the red box, right?

Then you should be running enough ROP to avoid any chance of detonation, i.e., outside the 'Red Fin' area.

Note that there are some differences between the 'Red Fin' and the information given above, especially below 75% power. Some folks think that the 'Red Fin' is somewhat conservative, and it probably is for 100LL, standard compression pistons, cool CHTs, cool oil temps, and cool OATs. But that's life, not everything is black and white (or red and yellow). But be careful with the mixture control above 75% power. At above 75% power, staying out of the 'Red Fin' should provide more than adequate detonation margins.
 
Last edited:
For those following along, there are a lot of other good VAF threads on the relationship between range, endurance, and glide speeds:


And good articles too:


In particular, the Russ Erb article provides some nice, simplifying formulas to sanity-check your experimentally measured speeds:

  • Vmax endurance = Best Glide Speed / 1.316
  • Vmax range = Best Glide Speed
  • Voptimum cruise (Carson's) = (Best Glide Speed) * 1.316

From other reading, I'm guessing that:

  • Vmax endurance = Minimum power required to sustain level flight
  • Vmax range = Best L/D with prop stopped, zero wind

Is this accurate? I suppose if you can measure just one of these with certainty, you should be able to simply calculate the others for free.

Anyway, there's a whole lot to learn here.
 
[*]Vmax range = Best L/D with prop stopped, zero wind

.

In a theoretically perfect airplane, maybe yes. But in most real airplanes the prop efficiency is not constant, but rather, at the low speeds typical of max range, increasing as speed increases. This pushes the max range speed to higher values than best glide speed.
 
Back
Top