Saville
Well Known Member
Hi all,
Lately I've gotten the bug to create a Flight Data Recorder using an Arduino or a Raspberry Pi. I've read Nigelspeedy's entries with interest, but he has the use of a system that's well beyond typical amateur finances.
I don't have a modern EFIS system that does the logging and I'm not likely to re-do the instrument panel any time soon.
This posting asks the questions:
1) Is Foreflight data logging data sufficiently accurate for Flight Test/40 hour Phase 1 work?
2) Is an Arduino or Raspberry Pi with GPS and data logger add-ons, fast and accurate enough for Flight Test/40 hour Phase 1 work.
My "yardstick" would be that I want a system that is accurate enough and fast enough to collect data for the Phase I, 40 hour fly off and the POH production.
One can get add-ons for either the Arduino or the Raspberry Pi that supply GPS data - longitude, latitude, and altitude, as well as data loggers which can store the data. So on the face of it it seems possible to build a system that will acquire the necessary data. And I've read article/s blogs, web pages where people have done that.
You could also add an OAT temperature gauge and perhaps even a sensor that's plumbed into the pitot system. That would be very handy.
But I wonder about the speed and accuracy of such systems.
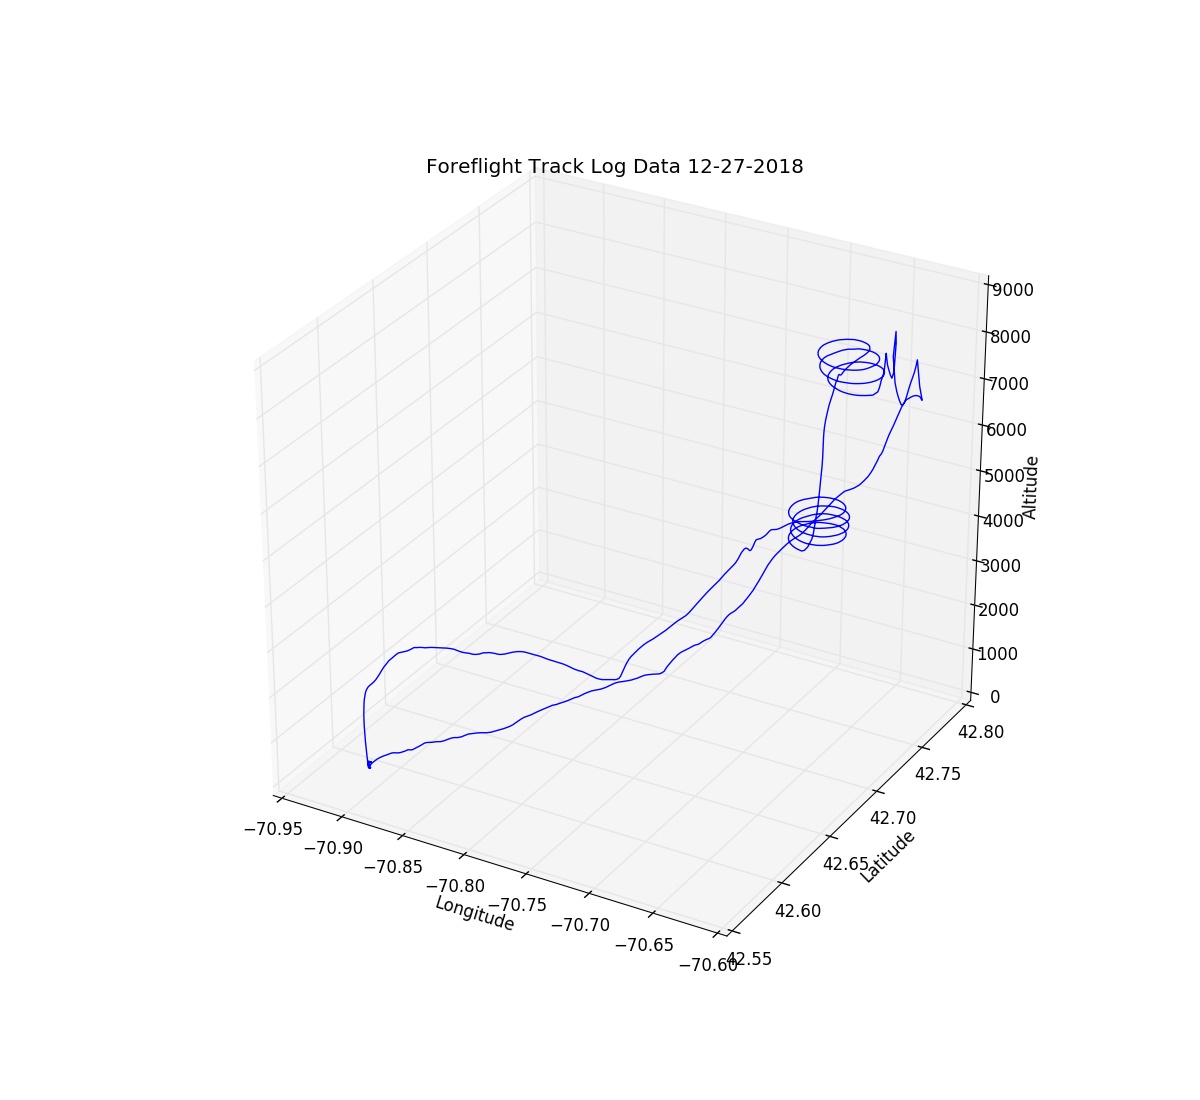
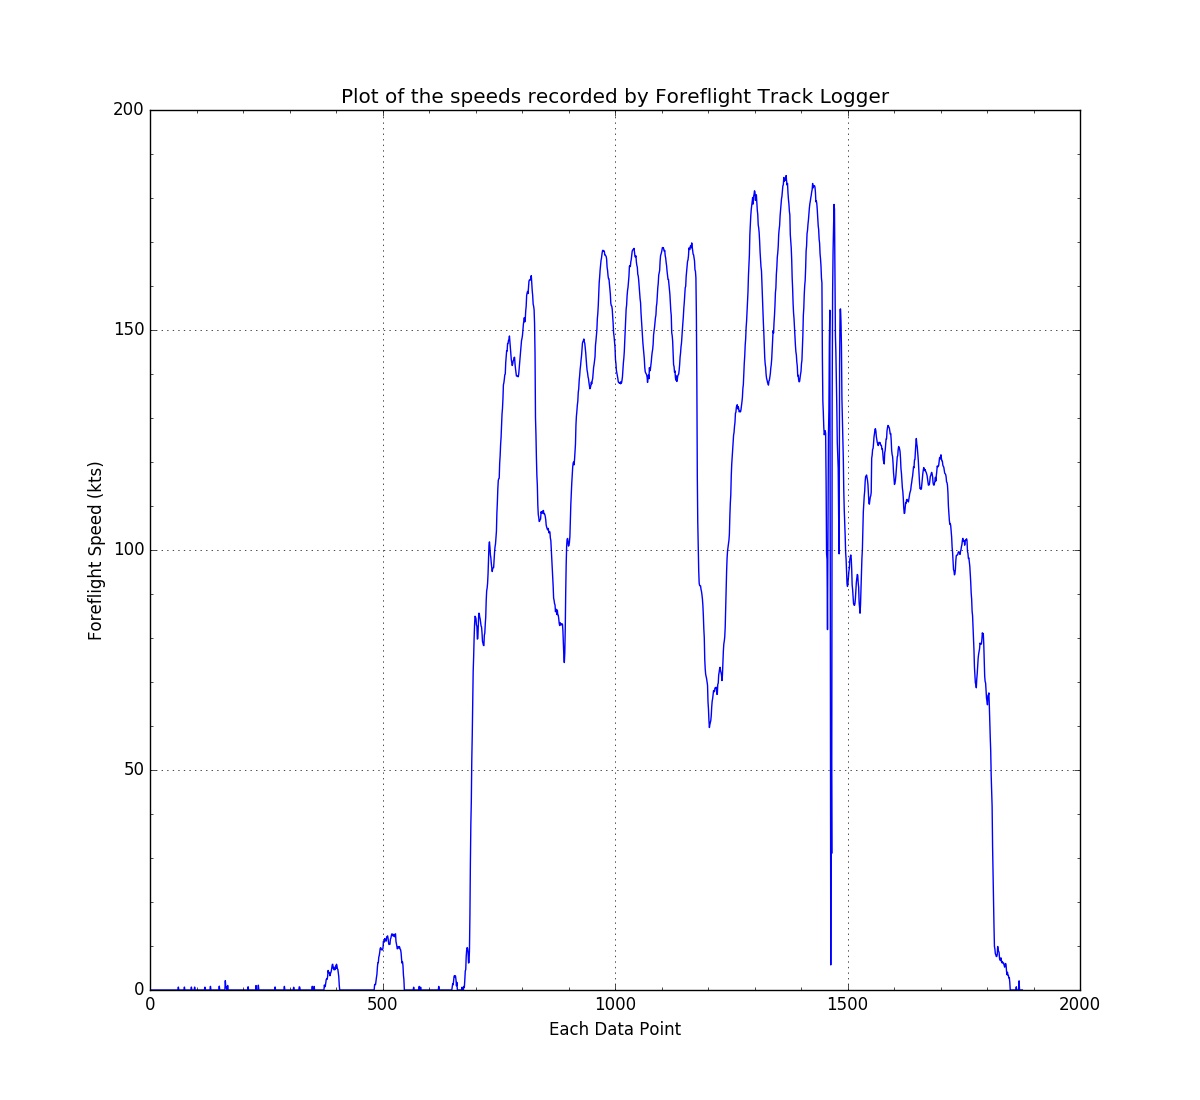
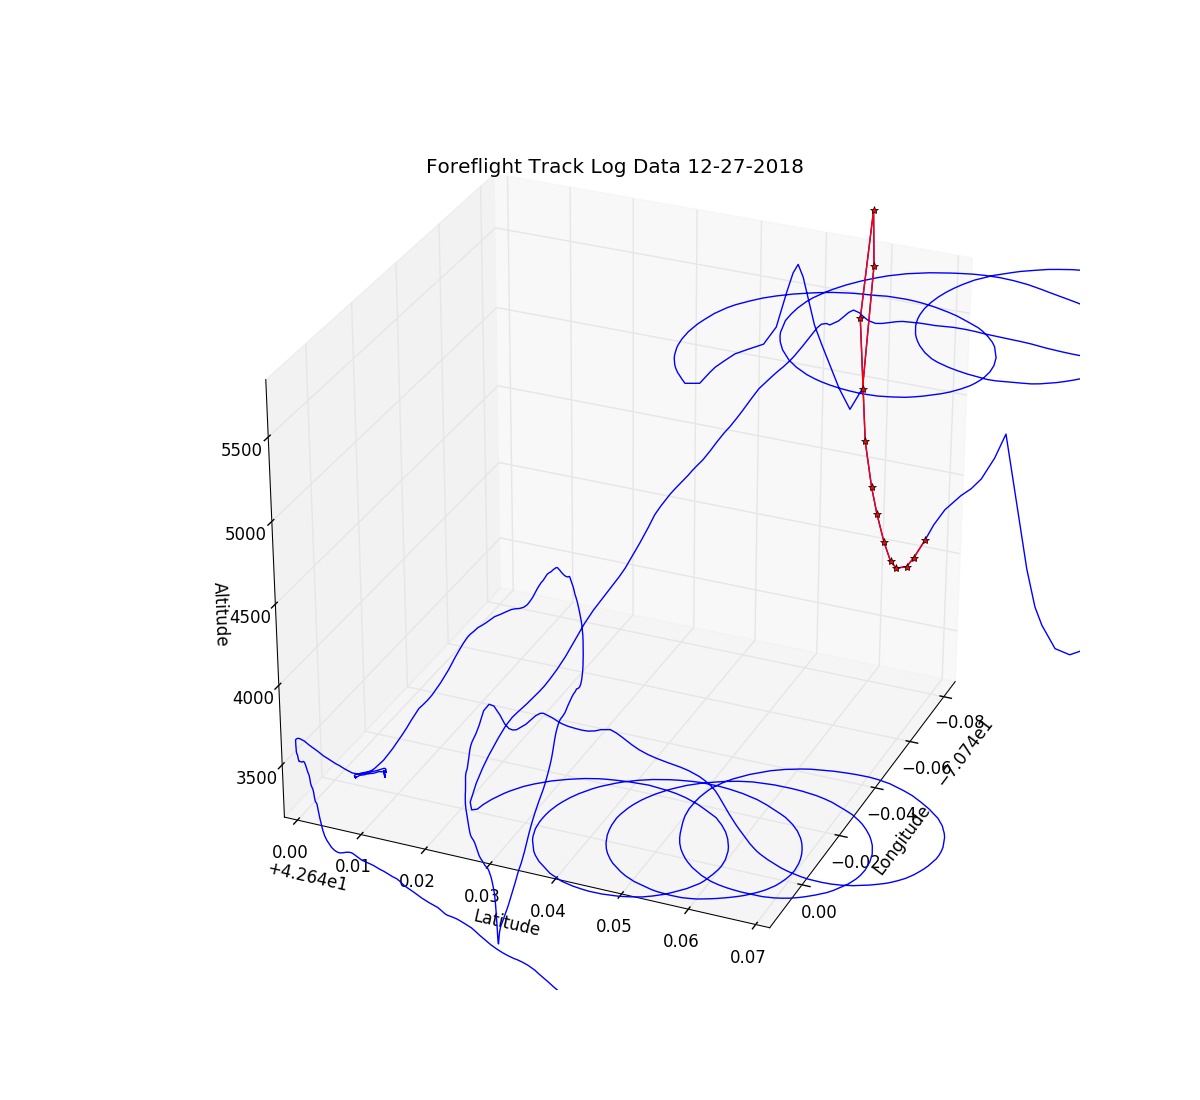
But then I remembered my Foreflight/iPad will log flight data and I looked at some of the KML files. I'm wondering if this is accurate enough. This is what I saw:
<altitudeMode>absolute</altitudeMode>
Evidently this means height above sea level. But what does it use for "sea Level"? MSL?
I have to figure out what this line means:
<gx:interpolate>1</gx:interpolate>
What is it interpolating? Successive GPS readings? How does this affect accuracy?
Then there's the data:
<when>2017-05-20T19:11:54.62Z</when>
<gx:coord>-70.911008 42.585208 31.0</gx:coord>
<when>2017-05-20T19:11:56.35Z</when>
<gx:coord>-70.911004 42.585210 32.0</gx:coord>
<when>2017-05-20T19:11:57.88Z</when>
<gx:coord>-70.911004 42.585211 32.0</gx:coord>
<when>2017-05-20T19:12:01.88Z</when>
<gx:coord>-70.911001 42.585216 33.0</gx:coord>
So the readings are not once a second. And here is a big jump of 5 seconds:
<when>2017-05-20T18:56:01.38Z</when>
<gx:coord>-71.471201 42.562610 1719.0</gx:coord>
<when>2017-05-20T18:56:05.02Z</when>
<gx:coord>-71.468250 42.562614 1714.0</gx:coord>
Are these data accurate enough to use to back out course, speed, climb/descent rate, takeoff roll?
I've done a search for Flight+data+recorder in the forum and there are some entries - mostly old.
Any thoughts would be appreciated.
Lately I've gotten the bug to create a Flight Data Recorder using an Arduino or a Raspberry Pi. I've read Nigelspeedy's entries with interest, but he has the use of a system that's well beyond typical amateur finances.
I don't have a modern EFIS system that does the logging and I'm not likely to re-do the instrument panel any time soon.
This posting asks the questions:
1) Is Foreflight data logging data sufficiently accurate for Flight Test/40 hour Phase 1 work?
2) Is an Arduino or Raspberry Pi with GPS and data logger add-ons, fast and accurate enough for Flight Test/40 hour Phase 1 work.
My "yardstick" would be that I want a system that is accurate enough and fast enough to collect data for the Phase I, 40 hour fly off and the POH production.
One can get add-ons for either the Arduino or the Raspberry Pi that supply GPS data - longitude, latitude, and altitude, as well as data loggers which can store the data. So on the face of it it seems possible to build a system that will acquire the necessary data. And I've read article/s blogs, web pages where people have done that.
You could also add an OAT temperature gauge and perhaps even a sensor that's plumbed into the pitot system. That would be very handy.
But I wonder about the speed and accuracy of such systems.
But then I remembered my Foreflight/iPad will log flight data and I looked at some of the KML files. I'm wondering if this is accurate enough. This is what I saw:
<altitudeMode>absolute</altitudeMode>
Evidently this means height above sea level. But what does it use for "sea Level"? MSL?
I have to figure out what this line means:
<gx:interpolate>1</gx:interpolate>
What is it interpolating? Successive GPS readings? How does this affect accuracy?
Then there's the data:
<when>2017-05-20T19:11:54.62Z</when>
<gx:coord>-70.911008 42.585208 31.0</gx:coord>
<when>2017-05-20T19:11:56.35Z</when>
<gx:coord>-70.911004 42.585210 32.0</gx:coord>
<when>2017-05-20T19:11:57.88Z</when>
<gx:coord>-70.911004 42.585211 32.0</gx:coord>
<when>2017-05-20T19:12:01.88Z</when>
<gx:coord>-70.911001 42.585216 33.0</gx:coord>
So the readings are not once a second. And here is a big jump of 5 seconds:
<when>2017-05-20T18:56:01.38Z</when>
<gx:coord>-71.471201 42.562610 1719.0</gx:coord>
<when>2017-05-20T18:56:05.02Z</when>
<gx:coord>-71.468250 42.562614 1714.0</gx:coord>
Are these data accurate enough to use to back out course, speed, climb/descent rate, takeoff roll?
I've done a search for Flight+data+recorder in the forum and there are some entries - mostly old.
Any thoughts would be appreciated.
Last edited:
")